If the 1st stand - "VELOEROGOMETRY"(velo-test) - was so simple that it could make any cardiologist who owns programming, THE COLOR - GRAF – on the contrary, it is a completely unique stand, because it reports about the myocardium information that for a long time will not be able to give, no other diagnostic system. And, it seems, will not be able in the next 100 or 200 years - before such diagnostic platforms are unlikely to appear. It's not so much the program - as its ideology. Allows you to organize the work of this stand on several levels:
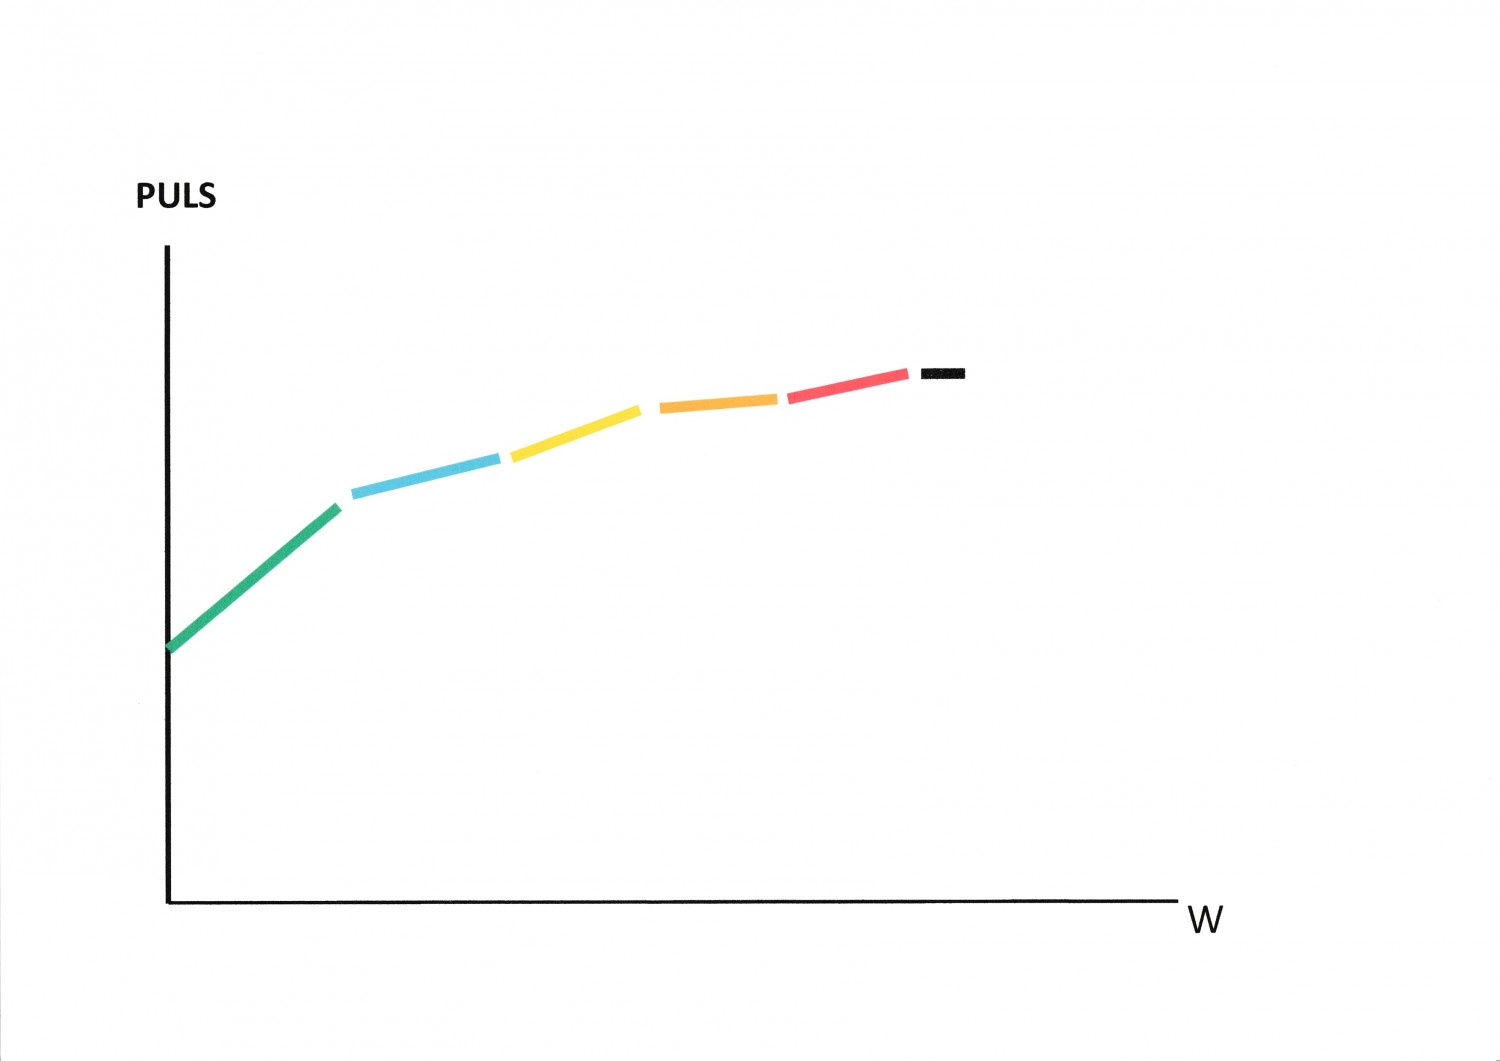
The first is a program that evaluates the state of the myocardium by neuro-biological model, which translates mathematical estimates into clinical concepts, after which, each clinically significant state of the myocardium is assigned a certain color. Since there was no point in staining the ECG, a standard heart rate chart was chosen:(1)
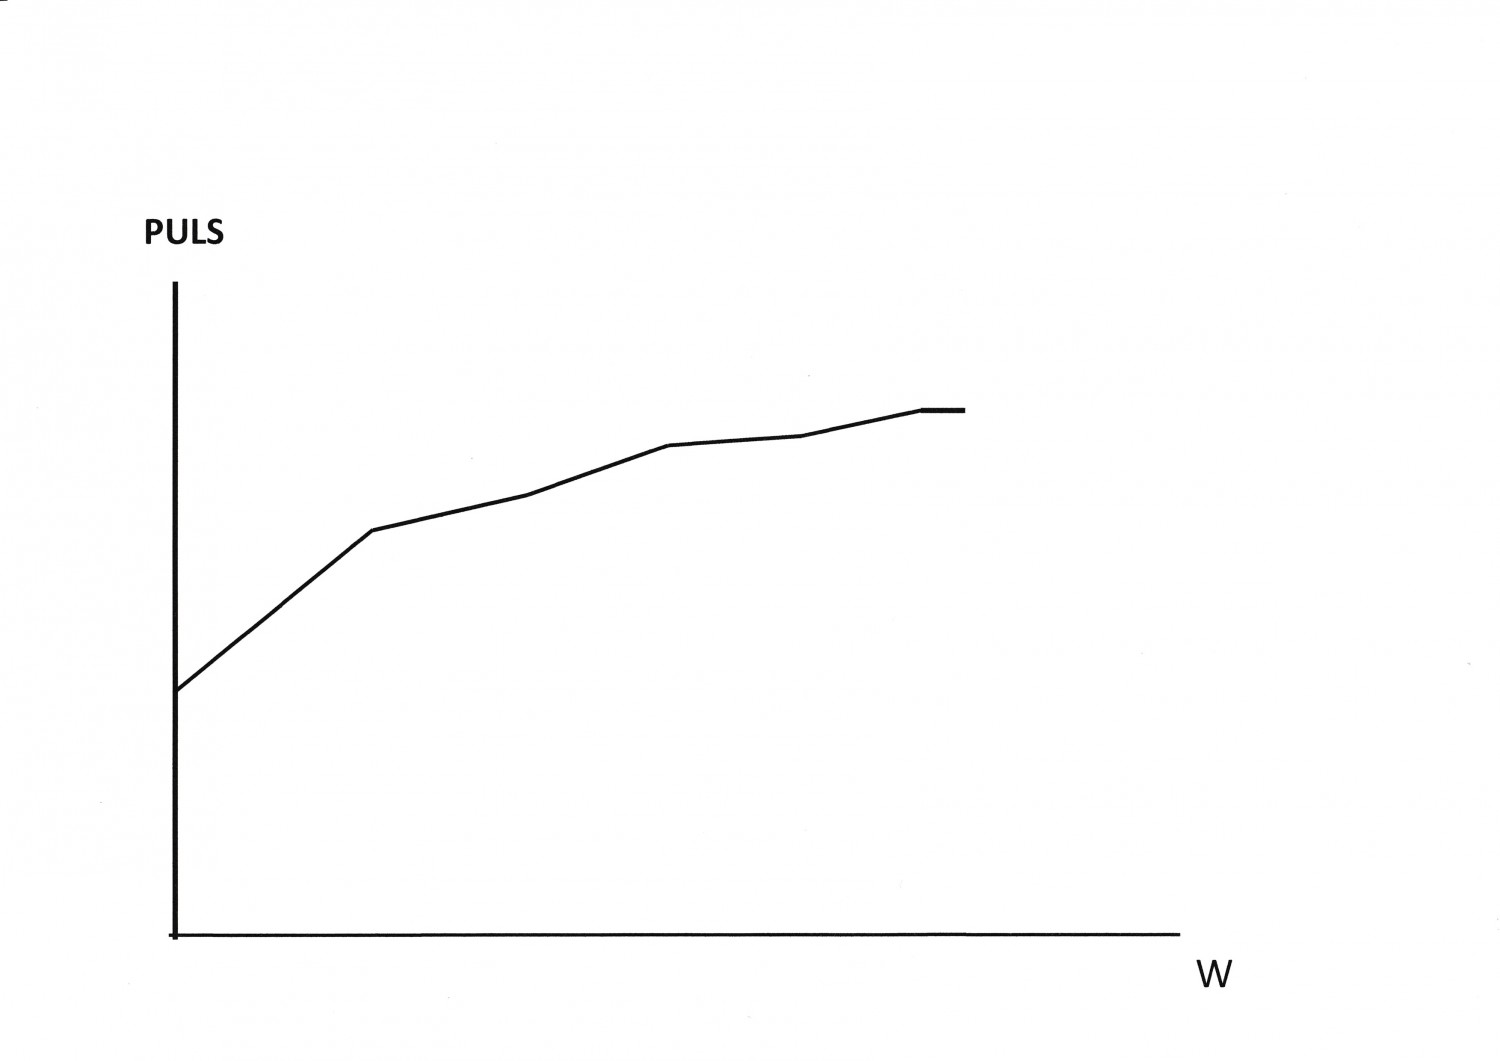
In clinical diagnosis pulse almost never used. Define usually the "basic" level, sometimes watch ortho- and clino- static test, at least the sample Mueller on the breath on the inhale and the exhale, and neurologists – and even symptom Aschner. Perhaps, all. Unlike sports medicine, where the pulse is the main indicator of the training process. Even and colorless, the pulse tells the doctor there is a lot: 2
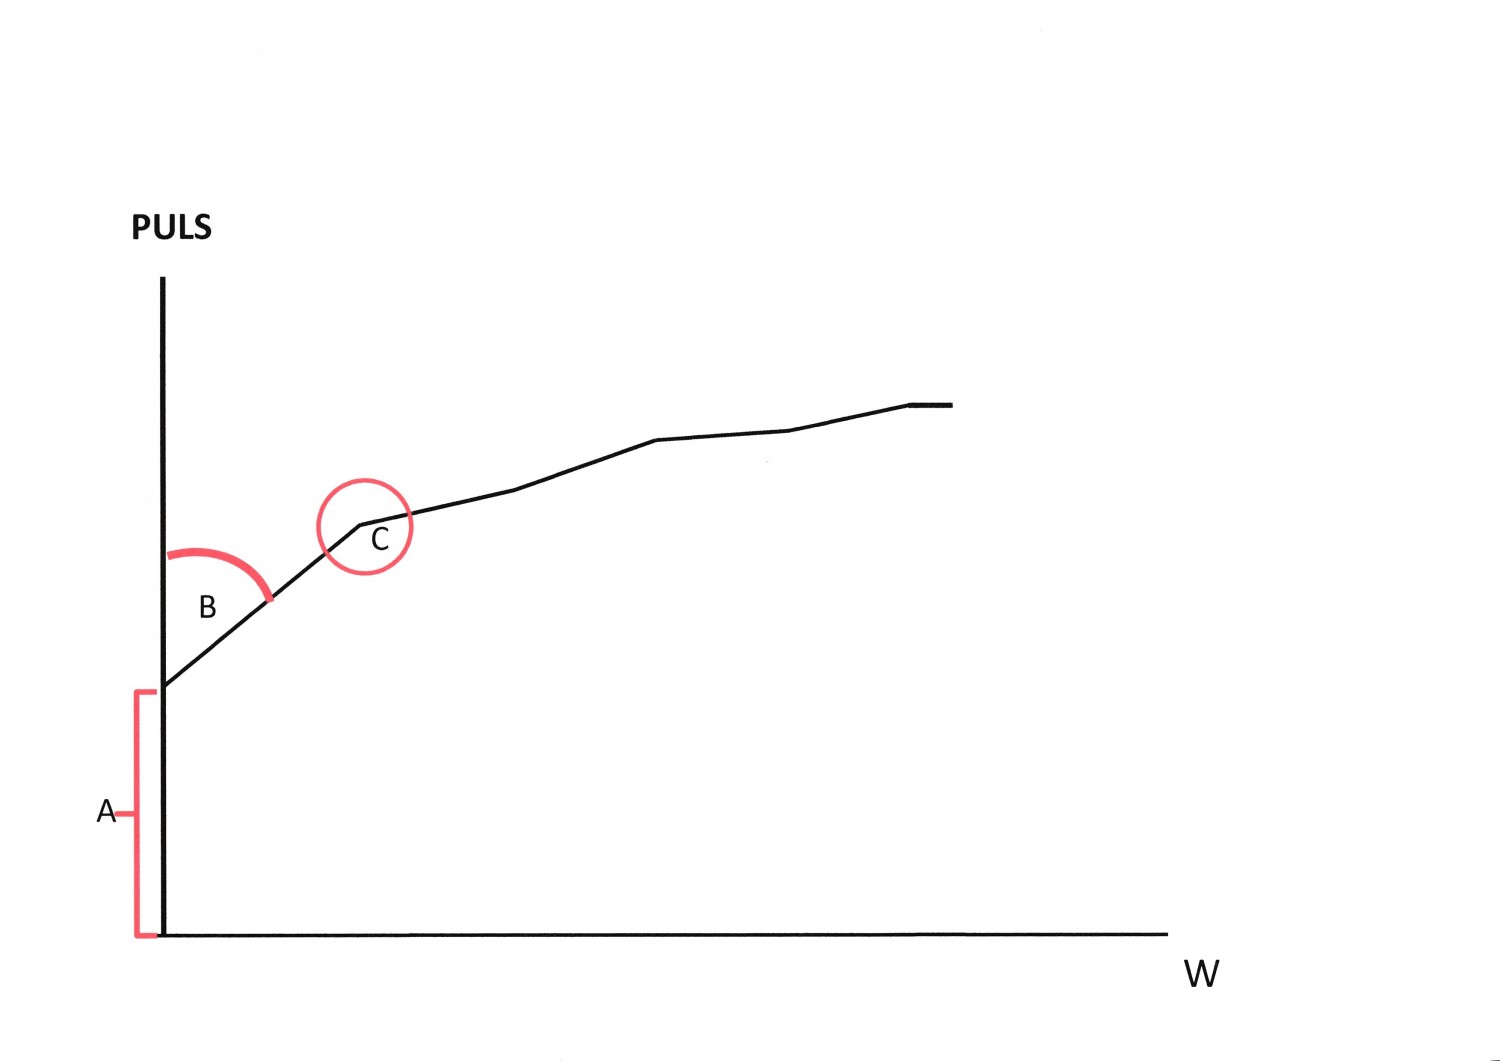
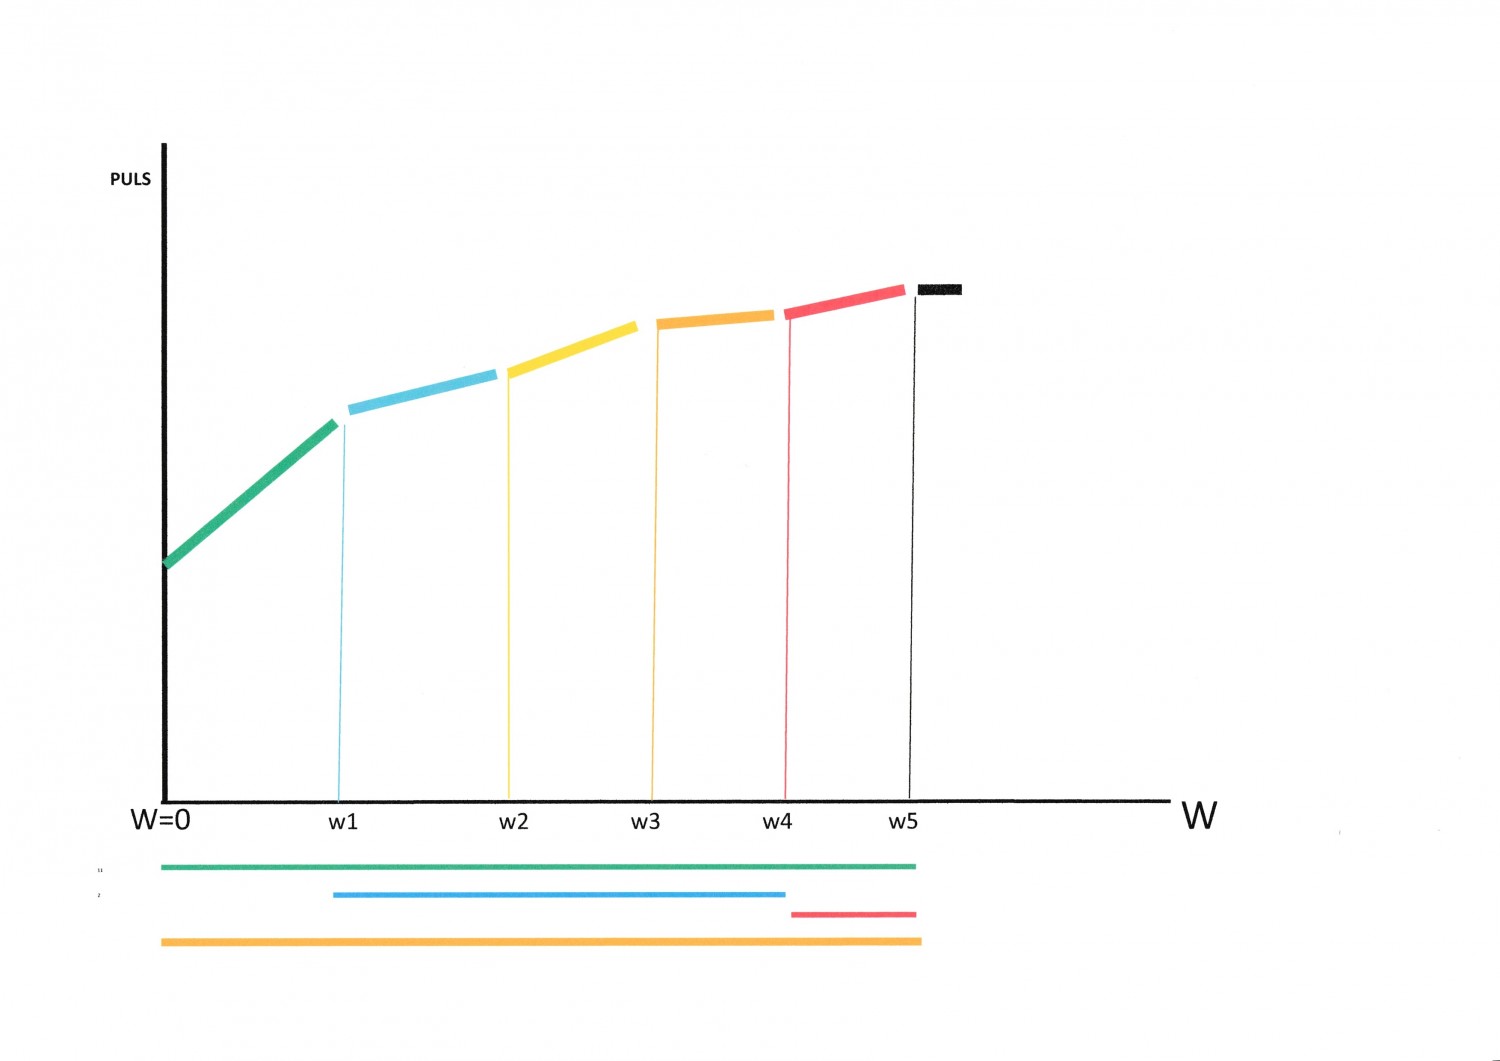
A - is the value of the "base" pulse, (rest pulse), which increases with age, after taking some drugs, stress and fatigue.
B - the sharpness of the angle of the initial segment of the graph with the ordinate pulse indicates the level of training of the cardiovascular system: the sharper the angle – the higher the training. .
The initial section of the graph - in the form of a straight line segment, characterizes the duration of the monopoly of aerobic respiration, which is regulated only by the pulse rate. Ends cut a "point deviation", indicating a connection already and anaerobic respiration:
C - is the "deflection point»
The "deflection point" will almost coincide with the "1st anaerobic barrier", equal to the oxygen consumption of 2 mol/liter. But the "2nd anaerobic barrier", equal to 8 mol/liter, is not determined on the colorless graph - it is determined only by measuring oxygen consumption.
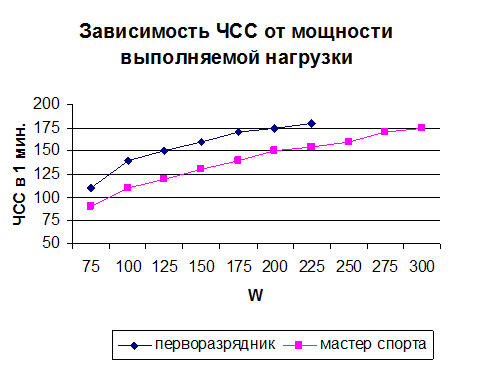
The pulse chart accurately reflects the physical condition of a person even when people are in fairly close physical condition - in sports, for example, it is a master of sports and an athlete who has I category: 3
Aerobic and anaerobic reserves create a total of "protective anti-ischemic myocardial buffer", so the definition of its boundaries – a fundamental point in the prognosis of the myocardium, and staining it on the chart, allows you to do it very accurately. There may be many colors (as well as myocardial States), but the program chooses only those that reflect clinically significant myocardial States: 6 colors characterize specific and 4 more colorless – transitional zones between them. Analysis of the myocardium turns a colorless graph of the pulse in the palette of all States of the heart muscle: from its absolute rest to the development of her ischemia, life-threatening : 4
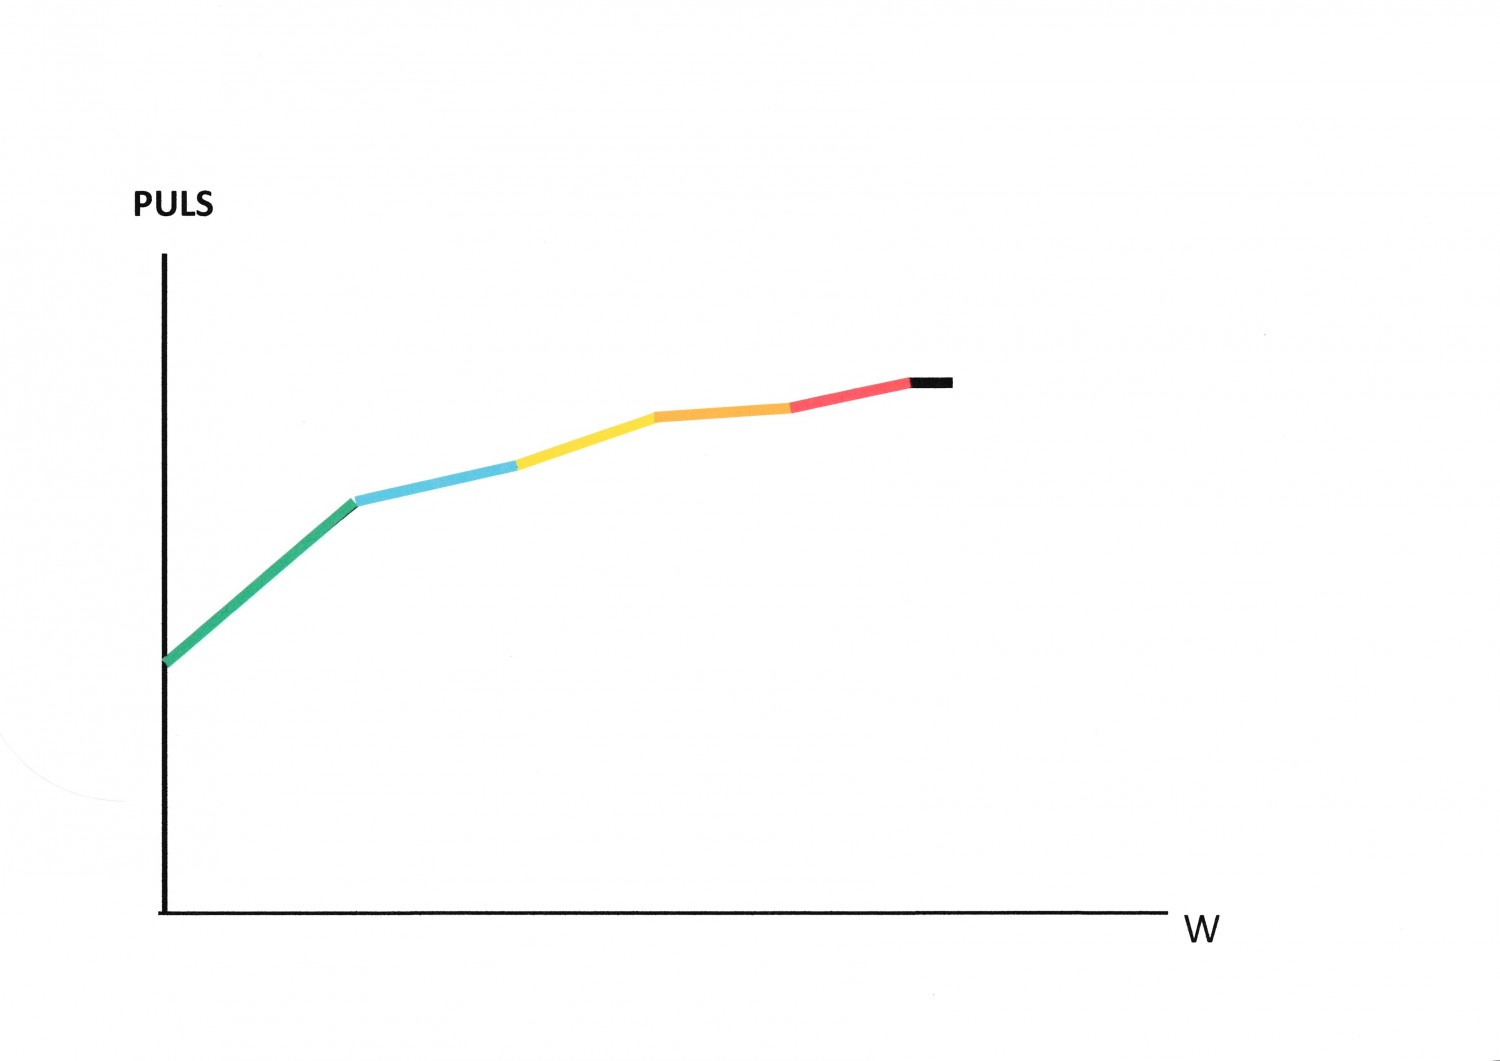
The pulse graph shows the full spectrum of all myocardial States that occur sequentially with increasing load from zero to maximum, where the color shows the duration of different myocardial States, where each color means a certain state:
green – myocardium is in perfect condition
blue - myocardium within the physiological norm
yellow - myocardium to successfully adapt to the load
orange - load get myocardium pre-morbid
red - load causes myocardial pathology
black - load threatens human life
Thus, the color of the pulse begins to report loads that cause a particular condition of the myocardium, and colorless segments on it about the presence of colorless "transition zones": 5
So there is a fundamentally new diagnostic platform, not only as detailed as possible informing about all the conditions of the myocardium, but also combining two different approaches, cardiology – clinical and sports. A platform that allows to determine the size of aerobic and anaerobic myocardial reserves, as well as the size of the anti-ischemic heart buffer only according to the pulse schedule, without oxygen measurement. What is important for the forecast, and to determine the allowable loads, and to determine life expectancy. The loads of the appearance and increase of myocardial ischemia, which is accompanied by a maximum expansion of the coronary arteries, which occurs in myocardial ischemia: 6

The pulse graph turns into a passport of the functional state of the myocardium, showing the size of all protective myocardial buffers: aerobic, anaerobic, adaptive, pre-ischemic and ischemic with transition zones between them. Where you can see what loads what conditions of the myocardium are caused: 7
That allows you to make any stress tests safe, expanding the diagnostic capabilities of early diagnosis of coronary artery disease.
Color-GRAF is a unique indicator of the myocardium – the only native person in a given time, which has no analogues in the world. From the ECG, which does not even have specific species (!) the program receives an indicator whose individuality exceeds the individuality of the fingerprint. Since the curves obtained by different people differ, not only in their General configuration, characterizing the age, level of fitness, States of coronary and myocardial reserves, which in itself is quite a lot, but also the size of its 5 color intervals, and 4 colorless intervals between them. Which can also change the dimensions. That is, the color chart contains a dozen variables in color and about the same in configuration. The number of permutations which creates from it a unique curve not only the indicator of the cardiovascular system, but also the system that responds to the slightest changes that occur with a person. Ranging from age, drugs, alcohol, doping, until a Cup of coffee and consequences conflict.
There is no analogues, extremely sensitive indicator of human condition. So much so that the cardiologist only needs to look at the color chart to find out not only in what condition a person is, but also how long he can live. This property allows you to use a COLOR-GRAF at several levels. Not only as an individual indicator of the state of the myocardium at a given time and a determinant of the usefulness of everything that a person eats and drinks, but also as a matrix of prognosis of the state of his myocardium: both without treatment and with it. But this is only the 1st level of application.
The second is to create on its basis multidimensional arrays-standards and arrays-prints, where the color chart, in the first case, works as an expert cardiological system, in the second – as a biological analyzer.
"Arrays-standards for age" determine the biological age of the myocardium by the degradation of the color chart with age, which is important for cardiac surgeons. The intelligence of the system suggests which treatment option will give a greater effect. "Arrays-standards" show what exactly, when and in what doses a person took.
Arrays-prints are created as combinations COLOR-GRAF with anthropometry, medical history, profession, social or environmental profile, and other factors. They characterize not personal, but anthropometric, medical, professional, social and ecological features in the state of the cardiovascular system in the population of cities, localities, regions and territories. With the assessment of the impact of professions, sociology and ecology on group (age, gender, social, professional, geographical, national, racial, sub-cultural) and the others group characteristics.
Arrays-prints of COLOR-GRAFS created by sex and age of healthy, compared with the same sex and age of the population in other (geographical, environmental and other) conditions. They can also characterize the group characteristics of taking drugs, drugs, doping, etc. So it becomes possible to obtain such unique indicators as:
1. The biological age of the myocardium of the area.
2. Find the most effective drug for the patient and his age group.
3. Determine the most popular in the household, professional or social attitude of the substance (including alcohol and drugs) that people take, and athletes allocate doping, the most popular in certain sports..
4. Make predictions about the life expectancy of any groups.
5. Another form of indirect examination occurs when you create a soft-arrays color - grafs by sex and age groups with the same anthropometric, anamnestic, social and environmental data the combination of VEM and subsequent coronary angiography. Which train the stress system to determine the state of coronary vessels by color chart during mass examinations of risk groups. Which can by VEM to provide information on the condition of the coronary arteries.
ADVANTAGES OF COLOR CHART:
1.Absolute safety of VEM, which does not require the presence of resuscitators and resuscitation equipment: the stress system does not offer the examinee "critical" loads, predicting the state of the myocardium to the load, without causing ischemia with depression interval ST>1 mm., and more often and 0.5 mm.
2.Constantly reports all States of the myocardium at rest and during exercise.
3.Reports information about the General, coronary, aerobic and anaerobic resources of the myocardium.
4.Sound (or light) warns if the next load causes myocardial ischemia.
5.Determines the effectiveness of the drug on its effects on the myocardium.
6.Reveals the hidden use of drugs, doping, stimulants
7. In sports, clinic, at home can be an intelligent simulator, and an expert cardiological system.
Color-graf, sequentially – at one VEM, can realize several levels of intelligence stress system:
The first is a mathematical model that assesses the state of the myocardium in parallel with the ECG and constantly reports on the state of the myocardium.
The second level is the comparison of human color charts over time to determine the effectiveness of treatment or the rate of aging.
The third level is the determination of the biological age of the myocardium and the use of drugs, drugs or doping by arrays-standards.
The fourth level – the definition of arrays-prints of group characteristics of color charts of the population of the area, age, professional or ethnic group.
The fifth level is the determination of the state of coronary vessels by soft arrays. Implemented training stress system to operate with arrays that combine data of 2 methods: color chart and coronary angiography, to determine at color-grafs coronary artery disease, their level and nature of the lesion.